brca1 for mouse Search Results


85
Bio-Rad western blot with anti brca1 ab 1
Western Blot With Anti Brca1 Ab 1, supplied by Bio-Rad, used in various techniques. Bioz Stars score: 85/100, based on 1 PubMed citations. ZERO BIAS - scores, article reviews, protocol conditions and more
https://www.bioz.com/result/western blot with anti brca1 ab 1/product/Bio-Rad
Average 85 stars, based on 1 article reviews
western blot with anti brca1 ab 1 - by Bioz Stars, 2026-04
85/100 stars
  Buy from Supplier

91
Bio-Rad brca1
Steady‐state levels of gastric cancer cell lines. Using Western blot assay, steady protein levels of <t>BRCA1,</t> BRCA2 and c‐MET are analysed in primary gastric cancer cell lines HS746T and AGS. Protein levels were normalized against actin
Brca1, supplied by Bio-Rad, used in various techniques. Bioz Stars score: 91/100, based on 1 PubMed citations. ZERO BIAS - scores, article reviews, protocol conditions and more
https://www.bioz.com/result/brca1/product/Bio-Rad
Average 91 stars, based on 1 article reviews
brca1 - by Bioz Stars, 2026-04
91/100 stars
  Buy from Supplier

92
OriGene mouse brca1 cdna
a tSNE analysis of immune cells from wildtype (WTMG, n = 6 mice), <t>Brca1-mutant</t> mammary glands (MTMG, n = 6 mice), Tu-Adj. mammary tissues (MT tumor adj. MG, n = 3 mice) from Brca1-MT mice, WT breast tumor (WT BT, n = 3 mice) and breast tumor (MT BT, n = 3 mice) from Brca1-MT mice. b , c The cell populations were classified as total T-cells (CD45 + CD3e + ), CD4 + T cells (CD45 + CD3e + CD4 + and CD8 - ), CD8 + T cells (CD45 + CD3e + CD4 - CD8 + ), MDSCs (CD45 + CD11b + Gr1 + ), PMN-MDSCs (CD45 + CD11b + Ly6G + Ly6C - ), and M-MDSCs (CD45 + CD11b + Ly6G - Ly6C + ). b Quantifications of total T-cells, CD4, and CD8 cells. c Quantifications of PMN-MDSCs, M-MDSCs, and total MDSCs by FlowJo analysis (Cytof gating strategies see in Supplementary Fig. , n = 3–6 mice same in a ). d – g Representative images of IHC staining with antibodies of S100a9 ( d ) or S100a8 ( f ), and quantifications of S100a9 ( e ) or S100a8 ( g ), ( n = 6–15 pictures from 3 mice/group, 6 pictures from WTMG, 9 from MTMG, 6 from adj.MG, 15 from WTBT, and 9 from MTBT, the number of each group same in e and g ). h The strategy of isolating CD11B + /GR1 + cells from mammary gland (MG), breast tumor (BT), and spleens (SP) for RNA-sequence and CD8 + T cells suppressive assay from the mice in a . i Principal Component Analysis (PCA) analysis of RNA-sequence data of CD11B + /GR1 + cells in h ( n = 3 mice/group). j MDSC signature genes enrichment in spleen by GSEA analysis by comparing gene expression from spleens of Brca1-MT (MT SP) vs WT (WT SP) mice and Brca1-MT mice with breast tumor (MT-BT SP) vs MT SP. k MDSC signature genes enrichment in mammary gland (MG) and breast tumor tissues (BT) by GSEA analysis by comparing gene expression from Brca1-MT mammary glands (MT MG) vs wild-type mammary glands (WT MG), and tumors from Brca1-MT (MT BT) and WT (WT BT) mice. l Representative CFSE flow-cytometry histograms and statistics from co-culture of WT T-cells with MDSCs from spleens. m Quantifications of % of CD8 + cells in each sample in l . The T-cell were from 2 months WT mice and MDSCs from spleens of 10-month Brca1-MT mice (Brca1-MT SP), Brca1-WT tumor-bearing mice (WT-BT SP) and Brca1-MT tumor-bearing mice (Brca1-MT-BT SP). Ratio of MDSC to T cells was 1:1 ( n = 3 mice/group). n Representative CFSE flow-cytometry histograms and statistics from co-culture of WT T-cells with MDSCs from MG and BT. o Quantifications of % of CD8 + cells in each sample in n . The T-cell were from 2 months WT mice and MDSCs from MG of 10-month Brca1-MT mice (Brca1-MT MG), breast tumor tissues of Brca1-WT tumor-bearing mice (WT BT) and Brca1-MT tumor-bearing mice (Brca1-MT BT). Ratio of MDSC to T cells was 1:1 ( n = 3 mice/group) (FACS gating strategies see in Supplementary Fig. ). The data are expressed as means ± SD ( b , c , e , g , m – o ) and P values determined by one-way ANOVA followed by Tukey’s multiple comparisons and permutation test. Scale bar: black color, 50 μM. Source data are provided as a Source data file.
Mouse Brca1 Cdna, supplied by OriGene, used in various techniques. Bioz Stars score: 92/100, based on 1 PubMed citations. ZERO BIAS - scores, article reviews, protocol conditions and more
https://www.bioz.com/result/mouse brca1 cdna/product/OriGene
Average 92 stars, based on 1 article reviews
mouse brca1 cdna - by Bioz Stars, 2026-04
92/100 stars
  Buy from Supplier

93
Bio-Rad monoclonal mouse antibodies
FIG. 1. Purification and functional char- acterization of dimeric TRF. A) Chromato- graphic profile of highly purified human TRF. The TRF solution was loaded onto an ultragel Aca44 column as described in Materials and Methods. OD, optical density. B) Each fraction was analyzed using native gel electrophoresis and immunoblotting. VLMB, very low-mobility band; LMB, low- mobility band; HMB, high-mobility band. C) Sensorgrams of interaction between high- and low-mobility purified fractions of hTRF and the <t>monoclonal</t> anti-hTRF anti- body. The interaction between both forms of hTRF and the monoclonal antibody is indicated by a dashed line. After reinjection of the monoclonal antibody, only the accessible epitope on the dimeric form generated a secondary signal (dark line), in contrast to the monomeric form (light line). The arrows directed to the top indicate the beginning of injection of the anti-hTRF antibody, and those directed toward the bottom indicate the end of the injections. The principle of discrimination between monomeric versus dimeric TRF by SPR is schematized on the right. RU, resonance units.
Monoclonal Mouse Antibodies, supplied by Bio-Rad, used in various techniques. Bioz Stars score: 93/100, based on 1 PubMed citations. ZERO BIAS - scores, article reviews, protocol conditions and more
https://www.bioz.com/result/monoclonal mouse antibodies/product/Bio-Rad
Average 93 stars, based on 1 article reviews
monoclonal mouse antibodies - by Bioz Stars, 2026-04
93/100 stars
  Buy from Supplier

90
GeneWorks primers for human and mouse brca1
FIG. 1. Purification and functional char- acterization of dimeric TRF. A) Chromato- graphic profile of highly purified human TRF. The TRF solution was loaded onto an ultragel Aca44 column as described in Materials and Methods. OD, optical density. B) Each fraction was analyzed using native gel electrophoresis and immunoblotting. VLMB, very low-mobility band; LMB, low- mobility band; HMB, high-mobility band. C) Sensorgrams of interaction between high- and low-mobility purified fractions of hTRF and the <t>monoclonal</t> anti-hTRF anti- body. The interaction between both forms of hTRF and the monoclonal antibody is indicated by a dashed line. After reinjection of the monoclonal antibody, only the accessible epitope on the dimeric form generated a secondary signal (dark line), in contrast to the monomeric form (light line). The arrows directed to the top indicate the beginning of injection of the anti-hTRF antibody, and those directed toward the bottom indicate the end of the injections. The principle of discrimination between monomeric versus dimeric TRF by SPR is schematized on the right. RU, resonance units.
Primers For Human And Mouse Brca1, supplied by GeneWorks, used in various techniques. Bioz Stars score: 90/100, based on 1 PubMed citations. ZERO BIAS - scores, article reviews, protocol conditions and more
https://www.bioz.com/result/primers for human and mouse brca1/product/GeneWorks
Average 90 stars, based on 1 article reviews
primers for human and mouse brca1 - by Bioz Stars, 2026-04
90/100 stars
  Buy from Supplier

90
Merck & Co mouse α brca1
(A) Selected results of a gene essentiality screen in <t>BRCA1-proficient</t> and -deficient RPE1 cells ( Adam et al. , 2021 ). Plotted is the CCA score: a higher score indicates a unique essentiality in BRCA1-deficient cells compared to -proficient cells. Dashed line indicates the cut-off for a significant CCA score (based on Adam et al. , 2021 ). (B) RPE1 hTERT cells expressing Cas9, either TP53 -/- (black lines) or TP53 -/- BRCA1 -/- (blue lines), were infected with indicated sgRNA together with GFP, or with an empty vector together with mCherry. GFP- and mCherry-positive cells were mixed 1:1, and the frequency of GFP-positive cells in the population was determined at multiple time points (n=4, mean±SEM). Western blot of lysates shown in supplemental figure 1A. (C) RPE1 hTERT PAC -/- TP53 -/- cells were genetically modified to generate a BRCA1-mAID-GFP fusion gene at the endogenous BRCA1 -locus. In this genetic background, two clonal EXO1 -/- cell lines were generated using gene editing techniques. Cells were treated with auxin (500 μM) for 48 hours or left untreated, and lysates were analysed by western blotting. (D) The cell lines described in were treated with 500 μM auxin, or left untreated, and clonogenic survival was determined. Lower panel shows a representative experiment, top panel shows the quantification (n=4, mean+SEM, *p<0.05, **p<0.01, paired t-test). (E) BRCA1 -mutated MDA-MB-436 cells, either WT or reconstituted with BRCA1, were infected with empty vector (CTRL) or EXO1 -targeting sgRNA and viability was measured using CellTiter-Glo (n=3, mean+SD, **p<0.01, paired t-test). (F) Lysates of the MDA-MB-436 cell lines described in were analysed by western blotting. (G) RPE1 hTERT TP53 -/- BRCA1-mAID-GFP cell lines were virally transduced to express Cas9 cDNA and the indicated gRNAs, followed by a clonogenic survival assay in presence or absence of 500 μM Auxin (n=3, mean+SD, **p<0.01, paired t-test). Western blot of lysates shown in supplemental figure 1L.
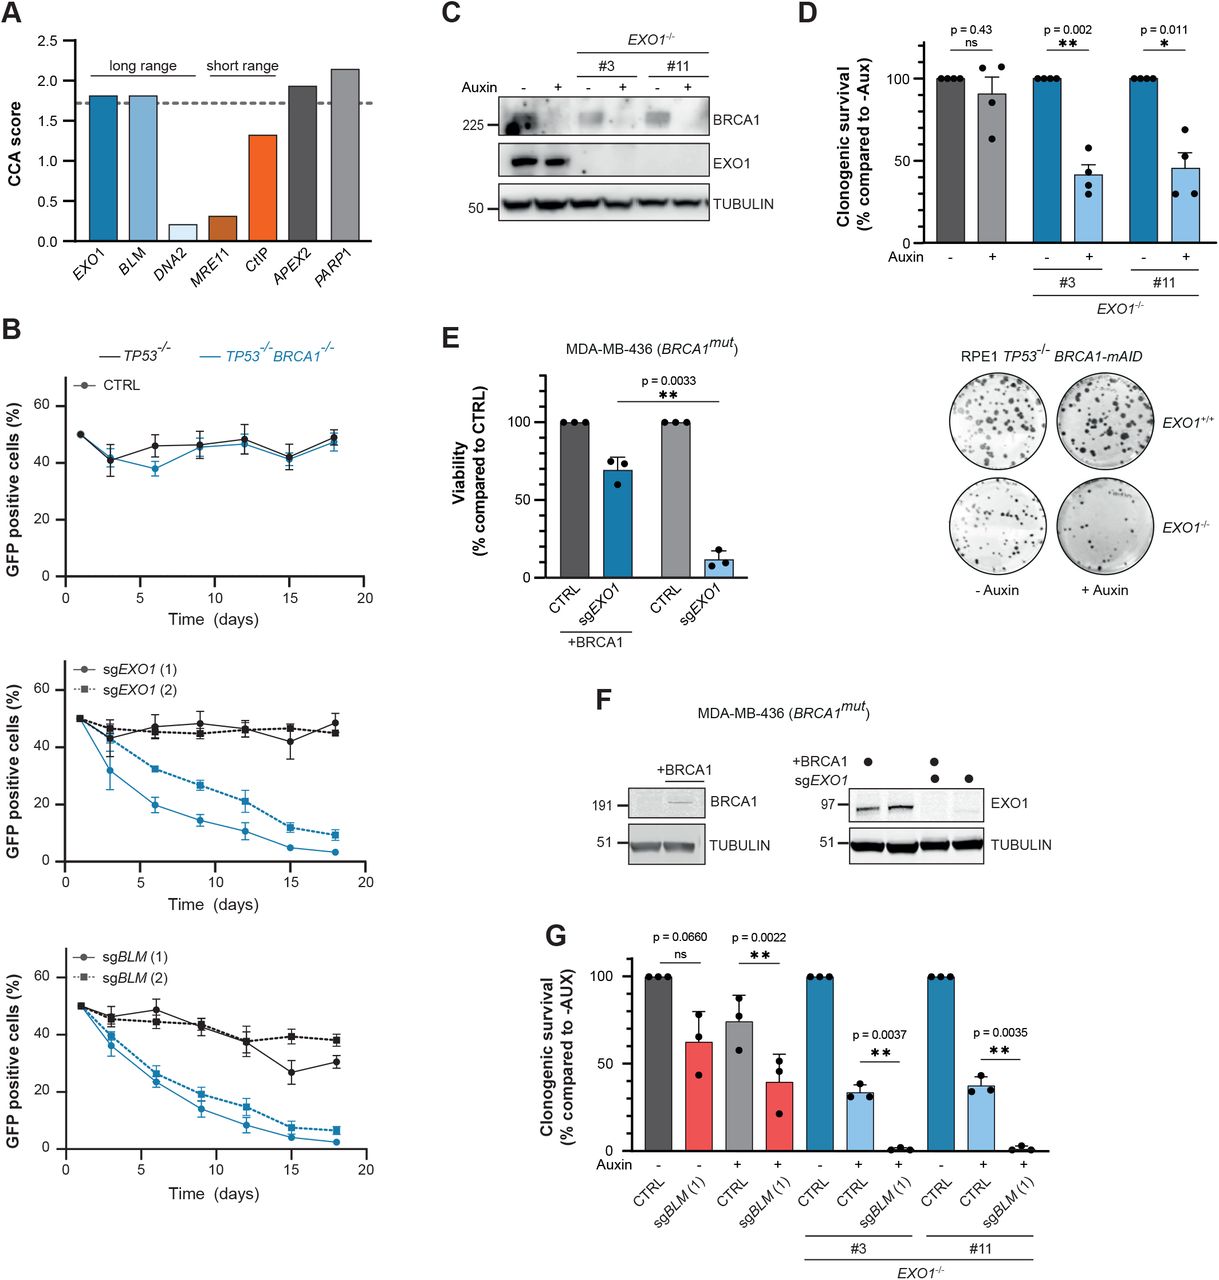
Mouse α Brca1, supplied by Merck & Co, used in various techniques. Bioz Stars score: 90/100, based on 1 PubMed citations. ZERO BIAS - scores, article reviews, protocol conditions and more
https://www.bioz.com/result/mouse α brca1/product/Merck & Co
Average 90 stars, based on 1 article reviews
mouse α brca1 - by Bioz Stars, 2026-04
90/100 stars
  Buy from Supplier

90
OriGene brca1 (nm_009764) mouse tagged orf clone
(A) Selected results of a gene essentiality screen in <t>BRCA1-proficient</t> and -deficient RPE1 cells ( Adam et al. , 2021 ). Plotted is the CCA score: a higher score indicates a unique essentiality in BRCA1-deficient cells compared to -proficient cells. Dashed line indicates the cut-off for a significant CCA score (based on Adam et al. , 2021 ). (B) RPE1 hTERT cells expressing Cas9, either TP53 -/- (black lines) or TP53 -/- BRCA1 -/- (blue lines), were infected with indicated sgRNA together with GFP, or with an empty vector together with mCherry. GFP- and mCherry-positive cells were mixed 1:1, and the frequency of GFP-positive cells in the population was determined at multiple time points (n=4, mean±SEM). Western blot of lysates shown in supplemental figure 1A. (C) RPE1 hTERT PAC -/- TP53 -/- cells were genetically modified to generate a BRCA1-mAID-GFP fusion gene at the endogenous BRCA1 -locus. In this genetic background, two clonal EXO1 -/- cell lines were generated using gene editing techniques. Cells were treated with auxin (500 μM) for 48 hours or left untreated, and lysates were analysed by western blotting. (D) The cell lines described in were treated with 500 μM auxin, or left untreated, and clonogenic survival was determined. Lower panel shows a representative experiment, top panel shows the quantification (n=4, mean+SEM, *p<0.05, **p<0.01, paired t-test). (E) BRCA1 -mutated MDA-MB-436 cells, either WT or reconstituted with BRCA1, were infected with empty vector (CTRL) or EXO1 -targeting sgRNA and viability was measured using CellTiter-Glo (n=3, mean+SD, **p<0.01, paired t-test). (F) Lysates of the MDA-MB-436 cell lines described in were analysed by western blotting. (G) RPE1 hTERT TP53 -/- BRCA1-mAID-GFP cell lines were virally transduced to express Cas9 cDNA and the indicated gRNAs, followed by a clonogenic survival assay in presence or absence of 500 μM Auxin (n=3, mean+SD, **p<0.01, paired t-test). Western blot of lysates shown in supplemental figure 1L.
Brca1 (Nm 009764) Mouse Tagged Orf Clone, supplied by OriGene, used in various techniques. Bioz Stars score: 90/100, based on 1 PubMed citations. ZERO BIAS - scores, article reviews, protocol conditions and more
https://www.bioz.com/result/brca1 (nm_009764) mouse tagged orf clone/product/OriGene
Average 90 stars, based on 1 article reviews
brca1 (nm_009764) mouse tagged orf clone - by Bioz Stars, 2026-04
90/100 stars
  Buy from Supplier

90
Obio Technology Corp Ltd sirnas targeting the mouse brca1 gene
(A) Selected results of a gene essentiality screen in <t>BRCA1-proficient</t> and -deficient RPE1 cells ( Adam et al. , 2021 ). Plotted is the CCA score: a higher score indicates a unique essentiality in BRCA1-deficient cells compared to -proficient cells. Dashed line indicates the cut-off for a significant CCA score (based on Adam et al. , 2021 ). (B) RPE1 hTERT cells expressing Cas9, either TP53 -/- (black lines) or TP53 -/- BRCA1 -/- (blue lines), were infected with indicated sgRNA together with GFP, or with an empty vector together with mCherry. GFP- and mCherry-positive cells were mixed 1:1, and the frequency of GFP-positive cells in the population was determined at multiple time points (n=4, mean±SEM). Western blot of lysates shown in supplemental figure 1A. (C) RPE1 hTERT PAC -/- TP53 -/- cells were genetically modified to generate a BRCA1-mAID-GFP fusion gene at the endogenous BRCA1 -locus. In this genetic background, two clonal EXO1 -/- cell lines were generated using gene editing techniques. Cells were treated with auxin (500 μM) for 48 hours or left untreated, and lysates were analysed by western blotting. (D) The cell lines described in were treated with 500 μM auxin, or left untreated, and clonogenic survival was determined. Lower panel shows a representative experiment, top panel shows the quantification (n=4, mean+SEM, *p<0.05, **p<0.01, paired t-test). (E) BRCA1 -mutated MDA-MB-436 cells, either WT or reconstituted with BRCA1, were infected with empty vector (CTRL) or EXO1 -targeting sgRNA and viability was measured using CellTiter-Glo (n=3, mean+SD, **p<0.01, paired t-test). (F) Lysates of the MDA-MB-436 cell lines described in were analysed by western blotting. (G) RPE1 hTERT TP53 -/- BRCA1-mAID-GFP cell lines were virally transduced to express Cas9 cDNA and the indicated gRNAs, followed by a clonogenic survival assay in presence or absence of 500 μM Auxin (n=3, mean+SD, **p<0.01, paired t-test). Western blot of lysates shown in supplemental figure 1L.
Sirnas Targeting The Mouse Brca1 Gene, supplied by Obio Technology Corp Ltd, used in various techniques. Bioz Stars score: 90/100, based on 1 PubMed citations. ZERO BIAS - scores, article reviews, protocol conditions and more
https://www.bioz.com/result/sirnas targeting the mouse brca1 gene/product/Obio Technology Corp Ltd
Average 90 stars, based on 1 article reviews
sirnas targeting the mouse brca1 gene - by Bioz Stars, 2026-04
90/100 stars
  Buy from Supplier

N/A
Brca1 CRISPRa kit CRISPR gene activation of mouse breast cancer 1 early onset
  Buy from Supplier

N/A
BRCA1 mouse monoclonal antibody clone 1C4 HRP conjugated
  Buy from Supplier

Image Search Results


Steady‐state levels of gastric cancer cell lines. Using Western blot assay, steady protein levels of BRCA1, BRCA2 and c‐MET are analysed in primary gastric cancer cell lines HS746T and AGS. Protein levels were normalized against actin

Journal: Journal of Cellular and Molecular Medicine

Article Title: Inhibition of c‐MET increases the antitumour activity of PARP inhibitors in gastric cancer models

doi: 10.1111/jcmm.15655

Figure Lengend Snippet: Steady‐state levels of gastric cancer cell lines. Using Western blot assay, steady protein levels of BRCA1, BRCA2 and c‐MET are analysed in primary gastric cancer cell lines HS746T and AGS. Protein levels were normalized against actin

Article Snippet: Antibodies were used against: BRCA1 (#MCA5946GT) was purchased from Bio‐Rad, BRCA2 (sc‐295185), actin (sc‐8035) and histone H2AX (#sc‐517336) were purchased from Santa Cruz Biotechnology, and PARP‐1 (#9542), cleaved caspase‐3 (#9661) and c‐Met (#8198) from Cell Signaling Technology.

Techniques: Western Blot

Low levels of c‐MET partially sensitize GC cell lines in PARP inhibition. A, HS746T/AGS cells, control‐siRNA‐Hs746T/AGS cells and si‐c‐MET Hs746T/AGS cells were exposed to increasing doses (0‐40 µmol/L) of NU1025 for 48 h for determination of cell viability (MTT metabolic activity assay). The protein levels of c‐MET expression (by Western blot analysis) revealed down‐regulation of the c‐MET receptor in both cell lines (HS746T and AGS); (B) HS746T cells, control‐siRNA‐Hs746T cells and si‐BRCA1/2 Hs746T cells were exposed to increasing doses (0‐40 µmol/L) of NU1025 for 48 h for determination of cell viability (MTT metabolic activity assay). The protein levels of BRCA1 and BRCA2 expression (by Western blot analysis) revealed down‐regulation of the BRCA1/2 in HS746T cell line; (C) HS746T cells, control‐siRNA‐Hs746T, siBRCA1/2‐Hs746T and siMET/BRCA1/2‐Hs746T cells were cultured with the indicated concentrations of NU1025 (5, 10 and 20 μmol/L) for 48 h for determination of cell viability (MTT metabolic activity assay). Error bars represent SD

Journal: Journal of Cellular and Molecular Medicine

Article Title: Inhibition of c‐MET increases the antitumour activity of PARP inhibitors in gastric cancer models

doi: 10.1111/jcmm.15655

Figure Lengend Snippet: Low levels of c‐MET partially sensitize GC cell lines in PARP inhibition. A, HS746T/AGS cells, control‐siRNA‐Hs746T/AGS cells and si‐c‐MET Hs746T/AGS cells were exposed to increasing doses (0‐40 µmol/L) of NU1025 for 48 h for determination of cell viability (MTT metabolic activity assay). The protein levels of c‐MET expression (by Western blot analysis) revealed down‐regulation of the c‐MET receptor in both cell lines (HS746T and AGS); (B) HS746T cells, control‐siRNA‐Hs746T cells and si‐BRCA1/2 Hs746T cells were exposed to increasing doses (0‐40 µmol/L) of NU1025 for 48 h for determination of cell viability (MTT metabolic activity assay). The protein levels of BRCA1 and BRCA2 expression (by Western blot analysis) revealed down‐regulation of the BRCA1/2 in HS746T cell line; (C) HS746T cells, control‐siRNA‐Hs746T, siBRCA1/2‐Hs746T and siMET/BRCA1/2‐Hs746T cells were cultured with the indicated concentrations of NU1025 (5, 10 and 20 μmol/L) for 48 h for determination of cell viability (MTT metabolic activity assay). Error bars represent SD

Article Snippet: Antibodies were used against: BRCA1 (#MCA5946GT) was purchased from Bio‐Rad, BRCA2 (sc‐295185), actin (sc‐8035) and histone H2AX (#sc‐517336) were purchased from Santa Cruz Biotechnology, and PARP‐1 (#9542), cleaved caspase‐3 (#9661) and c‐Met (#8198) from Cell Signaling Technology.

Techniques: Inhibition, Control, Metabolic Assay, Expressing, Western Blot, Cell Culture

Co‐inhibition of c‐MET (SU11274) and PARP (NU1025) sensitizes GC cells after knockdown BRCA1/2. Knocking down BRCA1 or BRCA2 sensitizes cells to PARP and c‐MET inhibition in HS746T cells expressing low levels of c‐MET (AGS cells, c‐MET knockdown Hs746T cells) to PARP inhibition. A, HS746T cells, control‐siRNA‐Hs746T cells and siBRCA1/2‐Hs746T (upper panel) and AGS (lower panel) cells were exposed to 5 µmol/L of NU1025 and/or 5 µmol/L of SU11274 for 48 h for determination of cell viability (MTT metabolic activity assay). Results are expressed as percentages. Average values of three experiments ± SD are shown; (B) Western blot analysis of PARP and cl.caspase‐3 in Hs746T‐control‐siRNA, siBRCA1/2‐Hs746T (upper panel) and AGS (lower panel) cell lines. Cells were cultured with the indicated drugs (5 μmol/L NU1025, 5 μmol/L SU11274 alone or in combination for 24 h of treatment). Protein levels were normalized against actin

Journal: Journal of Cellular and Molecular Medicine

Article Title: Inhibition of c‐MET increases the antitumour activity of PARP inhibitors in gastric cancer models

doi: 10.1111/jcmm.15655

Figure Lengend Snippet: Co‐inhibition of c‐MET (SU11274) and PARP (NU1025) sensitizes GC cells after knockdown BRCA1/2. Knocking down BRCA1 or BRCA2 sensitizes cells to PARP and c‐MET inhibition in HS746T cells expressing low levels of c‐MET (AGS cells, c‐MET knockdown Hs746T cells) to PARP inhibition. A, HS746T cells, control‐siRNA‐Hs746T cells and siBRCA1/2‐Hs746T (upper panel) and AGS (lower panel) cells were exposed to 5 µmol/L of NU1025 and/or 5 µmol/L of SU11274 for 48 h for determination of cell viability (MTT metabolic activity assay). Results are expressed as percentages. Average values of three experiments ± SD are shown; (B) Western blot analysis of PARP and cl.caspase‐3 in Hs746T‐control‐siRNA, siBRCA1/2‐Hs746T (upper panel) and AGS (lower panel) cell lines. Cells were cultured with the indicated drugs (5 μmol/L NU1025, 5 μmol/L SU11274 alone or in combination for 24 h of treatment). Protein levels were normalized against actin

Article Snippet: Antibodies were used against: BRCA1 (#MCA5946GT) was purchased from Bio‐Rad, BRCA2 (sc‐295185), actin (sc‐8035) and histone H2AX (#sc‐517336) were purchased from Santa Cruz Biotechnology, and PARP‐1 (#9542), cleaved caspase‐3 (#9661) and c‐Met (#8198) from Cell Signaling Technology.

Techniques: Inhibition, Knockdown, Expressing, Control, Metabolic Assay, Western Blot, Cell Culture

a tSNE analysis of immune cells from wildtype (WTMG, n = 6 mice), Brca1-mutant mammary glands (MTMG, n = 6 mice), Tu-Adj. mammary tissues (MT tumor adj. MG, n = 3 mice) from Brca1-MT mice, WT breast tumor (WT BT, n = 3 mice) and breast tumor (MT BT, n = 3 mice) from Brca1-MT mice. b , c The cell populations were classified as total T-cells (CD45 + CD3e + ), CD4 + T cells (CD45 + CD3e + CD4 + and CD8 - ), CD8 + T cells (CD45 + CD3e + CD4 - CD8 + ), MDSCs (CD45 + CD11b + Gr1 + ), PMN-MDSCs (CD45 + CD11b + Ly6G + Ly6C - ), and M-MDSCs (CD45 + CD11b + Ly6G - Ly6C + ). b Quantifications of total T-cells, CD4, and CD8 cells. c Quantifications of PMN-MDSCs, M-MDSCs, and total MDSCs by FlowJo analysis (Cytof gating strategies see in Supplementary Fig. , n = 3–6 mice same in a ). d – g Representative images of IHC staining with antibodies of S100a9 ( d ) or S100a8 ( f ), and quantifications of S100a9 ( e ) or S100a8 ( g ), ( n = 6–15 pictures from 3 mice/group, 6 pictures from WTMG, 9 from MTMG, 6 from adj.MG, 15 from WTBT, and 9 from MTBT, the number of each group same in e and g ). h The strategy of isolating CD11B + /GR1 + cells from mammary gland (MG), breast tumor (BT), and spleens (SP) for RNA-sequence and CD8 + T cells suppressive assay from the mice in a . i Principal Component Analysis (PCA) analysis of RNA-sequence data of CD11B + /GR1 + cells in h ( n = 3 mice/group). j MDSC signature genes enrichment in spleen by GSEA analysis by comparing gene expression from spleens of Brca1-MT (MT SP) vs WT (WT SP) mice and Brca1-MT mice with breast tumor (MT-BT SP) vs MT SP. k MDSC signature genes enrichment in mammary gland (MG) and breast tumor tissues (BT) by GSEA analysis by comparing gene expression from Brca1-MT mammary glands (MT MG) vs wild-type mammary glands (WT MG), and tumors from Brca1-MT (MT BT) and WT (WT BT) mice. l Representative CFSE flow-cytometry histograms and statistics from co-culture of WT T-cells with MDSCs from spleens. m Quantifications of % of CD8 + cells in each sample in l . The T-cell were from 2 months WT mice and MDSCs from spleens of 10-month Brca1-MT mice (Brca1-MT SP), Brca1-WT tumor-bearing mice (WT-BT SP) and Brca1-MT tumor-bearing mice (Brca1-MT-BT SP). Ratio of MDSC to T cells was 1:1 ( n = 3 mice/group). n Representative CFSE flow-cytometry histograms and statistics from co-culture of WT T-cells with MDSCs from MG and BT. o Quantifications of % of CD8 + cells in each sample in n . The T-cell were from 2 months WT mice and MDSCs from MG of 10-month Brca1-MT mice (Brca1-MT MG), breast tumor tissues of Brca1-WT tumor-bearing mice (WT BT) and Brca1-MT tumor-bearing mice (Brca1-MT BT). Ratio of MDSC to T cells was 1:1 ( n = 3 mice/group) (FACS gating strategies see in Supplementary Fig. ). The data are expressed as means ± SD ( b , c , e , g , m – o ) and P values determined by one-way ANOVA followed by Tukey’s multiple comparisons and permutation test. Scale bar: black color, 50 μM. Source data are provided as a Source data file.

Journal: Nature Communications

Article Title: S100A9-CXCL12 activation in BRCA1-mutant breast cancer promotes an immunosuppressive microenvironment associated with resistance to immunotherapy

doi: 10.1038/s41467-022-29151-5

Figure Lengend Snippet: a tSNE analysis of immune cells from wildtype (WTMG, n = 6 mice), Brca1-mutant mammary glands (MTMG, n = 6 mice), Tu-Adj. mammary tissues (MT tumor adj. MG, n = 3 mice) from Brca1-MT mice, WT breast tumor (WT BT, n = 3 mice) and breast tumor (MT BT, n = 3 mice) from Brca1-MT mice. b , c The cell populations were classified as total T-cells (CD45 + CD3e + ), CD4 + T cells (CD45 + CD3e + CD4 + and CD8 - ), CD8 + T cells (CD45 + CD3e + CD4 - CD8 + ), MDSCs (CD45 + CD11b + Gr1 + ), PMN-MDSCs (CD45 + CD11b + Ly6G + Ly6C - ), and M-MDSCs (CD45 + CD11b + Ly6G - Ly6C + ). b Quantifications of total T-cells, CD4, and CD8 cells. c Quantifications of PMN-MDSCs, M-MDSCs, and total MDSCs by FlowJo analysis (Cytof gating strategies see in Supplementary Fig. , n = 3–6 mice same in a ). d – g Representative images of IHC staining with antibodies of S100a9 ( d ) or S100a8 ( f ), and quantifications of S100a9 ( e ) or S100a8 ( g ), ( n = 6–15 pictures from 3 mice/group, 6 pictures from WTMG, 9 from MTMG, 6 from adj.MG, 15 from WTBT, and 9 from MTBT, the number of each group same in e and g ). h The strategy of isolating CD11B + /GR1 + cells from mammary gland (MG), breast tumor (BT), and spleens (SP) for RNA-sequence and CD8 + T cells suppressive assay from the mice in a . i Principal Component Analysis (PCA) analysis of RNA-sequence data of CD11B + /GR1 + cells in h ( n = 3 mice/group). j MDSC signature genes enrichment in spleen by GSEA analysis by comparing gene expression from spleens of Brca1-MT (MT SP) vs WT (WT SP) mice and Brca1-MT mice with breast tumor (MT-BT SP) vs MT SP. k MDSC signature genes enrichment in mammary gland (MG) and breast tumor tissues (BT) by GSEA analysis by comparing gene expression from Brca1-MT mammary glands (MT MG) vs wild-type mammary glands (WT MG), and tumors from Brca1-MT (MT BT) and WT (WT BT) mice. l Representative CFSE flow-cytometry histograms and statistics from co-culture of WT T-cells with MDSCs from spleens. m Quantifications of % of CD8 + cells in each sample in l . The T-cell were from 2 months WT mice and MDSCs from spleens of 10-month Brca1-MT mice (Brca1-MT SP), Brca1-WT tumor-bearing mice (WT-BT SP) and Brca1-MT tumor-bearing mice (Brca1-MT-BT SP). Ratio of MDSC to T cells was 1:1 ( n = 3 mice/group). n Representative CFSE flow-cytometry histograms and statistics from co-culture of WT T-cells with MDSCs from MG and BT. o Quantifications of % of CD8 + cells in each sample in n . The T-cell were from 2 months WT mice and MDSCs from MG of 10-month Brca1-MT mice (Brca1-MT MG), breast tumor tissues of Brca1-WT tumor-bearing mice (WT BT) and Brca1-MT tumor-bearing mice (Brca1-MT BT). Ratio of MDSC to T cells was 1:1 ( n = 3 mice/group) (FACS gating strategies see in Supplementary Fig. ). The data are expressed as means ± SD ( b , c , e , g , m – o ) and P values determined by one-way ANOVA followed by Tukey’s multiple comparisons and permutation test. Scale bar: black color, 50 μM. Source data are provided as a Source data file.

Article Snippet: Mouse Brca1 cDNA (Cat# MG212086) was purchased from Origene.

Techniques: Mutagenesis, Immunohistochemistry, Sequencing, Expressing, Flow Cytometry, Co-Culture Assay

a Workflow of DIA-MS analysis with mammary tissues during tumorigenesis, including mammary gland tissues from 8–10 months Wild type (WTMG) and Brca1-MT (MTMG) virgin mice, tumor- adjacent mammary tissues (Tu-Adj. MG), and tumors from both Wild type (WTBT) and Brca1-MT (MTBT) mice ( n = 3 mice/per genotype). b Plot of Principal Component Analysis (PCA) of samples from the same cohort of samples in ( a ). c Pearson correlation analysis of duplicate of each sample from the same cohort samples in a . d The patterns of increased the protein level of S100A9 during tumorigenesis with the same cohort of samples in a from DIA data analysis with Spectronaut and statistics analysis by Pearson correlation (FDR < 1, r = 0.8343, adjust p value = 0.024. The raw data are transformed by log10,the box and whisker plots summarize the normalized values, line show the SD). The data are from n = 3 biologically independent replicates. e Pearson correlation of BRCA1 and S100A9 at protein level by volcano plot from Clinical Proteomics Tumor Analysis Consortium (CPTAC) for The Cancer Genomic Atlas (TCGA) database ( http://www.linkedomics.org/admin.php ). f Heatmap of top 50 genes which are negatively correlated with BRCA1 at protein level from e . g Overlapping of mouse candidate gene lists from DIA analysis with top 45 genes which are negatively regulated by BRCA1 genes. h The representative images of S100A9 antibody staining on BRCA1-WT and BRCA1-MT breast cancer tissues ( n = 2 in each group from PDX models) were obtained from Jackson Laboratory. i Quantifications of S100A9 positive cells per field in h , ( n = 22 pictures from WT and 30 from MT in h models). j Survival outcome based on S100A9 expression of breast cancer patients ( n = 4934) from Kaplan–Meier Plotter website ( https://kmplot.com/analysis/index.php?p=service&cancer=breast ). k , l Relative expression of S100a9 and S100a8 of mammary tissues in 4-months Brca1-WT and MT virgin mice ( k ) and Brca1 MT and WT mammary tumors ( l ) revealed by qPCR ( n = 3 mice/group) and the number of dots represents biological replicates). m , n Protein levels of S100a9 and S100a8 in 4-month-old mammary tissues ( m ), and in Brca1 MT and WT tumors ( n ) as determined by western blots ( n = 3 mice/group). The data are expressed as means ± SD ( d , i , k , l ) and P values determined by unpaired two-tailed Student’s t test ( i , k , l ). Scale bar: black color, 50 μM. Source data are provided as a Source data file.

Journal: Nature Communications

Article Title: S100A9-CXCL12 activation in BRCA1-mutant breast cancer promotes an immunosuppressive microenvironment associated with resistance to immunotherapy

doi: 10.1038/s41467-022-29151-5

Figure Lengend Snippet: a Workflow of DIA-MS analysis with mammary tissues during tumorigenesis, including mammary gland tissues from 8–10 months Wild type (WTMG) and Brca1-MT (MTMG) virgin mice, tumor- adjacent mammary tissues (Tu-Adj. MG), and tumors from both Wild type (WTBT) and Brca1-MT (MTBT) mice ( n = 3 mice/per genotype). b Plot of Principal Component Analysis (PCA) of samples from the same cohort of samples in ( a ). c Pearson correlation analysis of duplicate of each sample from the same cohort samples in a . d The patterns of increased the protein level of S100A9 during tumorigenesis with the same cohort of samples in a from DIA data analysis with Spectronaut and statistics analysis by Pearson correlation (FDR < 1, r = 0.8343, adjust p value = 0.024. The raw data are transformed by log10,the box and whisker plots summarize the normalized values, line show the SD). The data are from n = 3 biologically independent replicates. e Pearson correlation of BRCA1 and S100A9 at protein level by volcano plot from Clinical Proteomics Tumor Analysis Consortium (CPTAC) for The Cancer Genomic Atlas (TCGA) database ( http://www.linkedomics.org/admin.php ). f Heatmap of top 50 genes which are negatively correlated with BRCA1 at protein level from e . g Overlapping of mouse candidate gene lists from DIA analysis with top 45 genes which are negatively regulated by BRCA1 genes. h The representative images of S100A9 antibody staining on BRCA1-WT and BRCA1-MT breast cancer tissues ( n = 2 in each group from PDX models) were obtained from Jackson Laboratory. i Quantifications of S100A9 positive cells per field in h , ( n = 22 pictures from WT and 30 from MT in h models). j Survival outcome based on S100A9 expression of breast cancer patients ( n = 4934) from Kaplan–Meier Plotter website ( https://kmplot.com/analysis/index.php?p=service&cancer=breast ). k , l Relative expression of S100a9 and S100a8 of mammary tissues in 4-months Brca1-WT and MT virgin mice ( k ) and Brca1 MT and WT mammary tumors ( l ) revealed by qPCR ( n = 3 mice/group) and the number of dots represents biological replicates). m , n Protein levels of S100a9 and S100a8 in 4-month-old mammary tissues ( m ), and in Brca1 MT and WT tumors ( n ) as determined by western blots ( n = 3 mice/group). The data are expressed as means ± SD ( d , i , k , l ) and P values determined by unpaired two-tailed Student’s t test ( i , k , l ). Scale bar: black color, 50 μM. Source data are provided as a Source data file.

Article Snippet: Mouse Brca1 cDNA (Cat# MG212086) was purchased from Origene.

Techniques: Transformation Assay, Whisker Assay, Staining, Expressing, Western Blot, Two Tailed Test

a Expression of S100a9 and S100a8 in Brca1 MT (G600) and WT (B477) mammary epithelial cell lines. b Expression of S100a9 and S100a8 in B477 cells with the expression of sh Brca1 at different concentrations. c Expression of S100a9 and S100a8 in B477 cells in which the mBrca1 gene was overexpressed. d Expression of S100A9 and S100A8 in MDA-MB-231 (231) control and 231 cells with the expression of sh BRCA1 (knock down BRCA1 ). e Luciferase activity assay of mouse S100a9 promoter after 72 h transfection with PGL vector only, S100a9 promotor, S100a9 promotor with Brca1 cDNA, and S100a9 promotor with S100a9 cDNA in B477 and G600 cells. f S100A9 proteins in B477 mouse mammary epithelial cells and 231 cells with the expression of shBrca1 or shBRCA1, respectively by IF. g BRCA1 and S100A9 protein levels in B477 mouse WT mammary epithelial cells and 231 cells without or with the expression of sh BRCA1 (shBr/shBR). The data are expressed as means ± SD ( a – e ) and P values determined by unpaired two-tailed Student’s t test ( a , c , d ) and by one-way ANOVA followed by Tukey’s multiple comparisons ( b ) or two-way ANOVA ( e ). The experiments were independently repeated three times with similar results ( a – g ). Scale bar: white color, 20 μM. Source data are provided as a Source data file.

Journal: Nature Communications

Article Title: S100A9-CXCL12 activation in BRCA1-mutant breast cancer promotes an immunosuppressive microenvironment associated with resistance to immunotherapy

doi: 10.1038/s41467-022-29151-5

Figure Lengend Snippet: a Expression of S100a9 and S100a8 in Brca1 MT (G600) and WT (B477) mammary epithelial cell lines. b Expression of S100a9 and S100a8 in B477 cells with the expression of sh Brca1 at different concentrations. c Expression of S100a9 and S100a8 in B477 cells in which the mBrca1 gene was overexpressed. d Expression of S100A9 and S100A8 in MDA-MB-231 (231) control and 231 cells with the expression of sh BRCA1 (knock down BRCA1 ). e Luciferase activity assay of mouse S100a9 promoter after 72 h transfection with PGL vector only, S100a9 promotor, S100a9 promotor with Brca1 cDNA, and S100a9 promotor with S100a9 cDNA in B477 and G600 cells. f S100A9 proteins in B477 mouse mammary epithelial cells and 231 cells with the expression of shBrca1 or shBRCA1, respectively by IF. g BRCA1 and S100A9 protein levels in B477 mouse WT mammary epithelial cells and 231 cells without or with the expression of sh BRCA1 (shBr/shBR). The data are expressed as means ± SD ( a – e ) and P values determined by unpaired two-tailed Student’s t test ( a , c , d ) and by one-way ANOVA followed by Tukey’s multiple comparisons ( b ) or two-way ANOVA ( e ). The experiments were independently repeated three times with similar results ( a – g ). Scale bar: white color, 20 μM. Source data are provided as a Source data file.

Article Snippet: Mouse Brca1 cDNA (Cat# MG212086) was purchased from Origene.

Techniques: Expressing, Luciferase, Activity Assay, Transfection, Plasmid Preparation, Two Tailed Test

a S100a9/S100a8 mRNA expression in the subpopulations of luminal and stromal cells of WT 4-month mammary gland (WTV4MG) and MT 4-months-old virgin mammary gland (MTV4MG) ( n = 3 mice). b Protein level of S100a9 in both WT (B477) and MT (G600) mammary epithelial cell lines and tumor tissues by Western blots ( n = 3 individual experiment-up and n = 3 mice-down). c Co-staining of S100a9 (red) and CK18 (green) with antibodies on WTV4MG, MTV4MG, WTV6MG, and MTV6MG tissues ( n = 3 pairs in each group, Scale bar: 20 μM). d The S100a9 and Arg1 positive cell populations by FACS analysis from the blood and mammary tissues of both WT and MT mice at 4-month and 6-month, respectively (FACS gating strategies see in Supplementary Fig. , n = 3 mice/ group). e Co-staining with S100a9 (red) and CD206 (green) antibodies (left panel) and co-staining with S100a9 (red) and CK18 (green) antibodies (right panel) on tumor-adjacent tissues by IF (40X confocal microscope, Scale bar: 20 μM.) ( n = 3 mice and 3 individual experiment). f Secreted S100a9 proteins (left) from both tumor cell and MDSC cells in tumor-adjacent mammary gland ( n = 3 mice) and present in the supernatant of cultured cancer cells (right) ( n = 3 individual experiment, Scale bar: 10 μM). g Protein levels of S100a9, TGF-β, and Il-10 in mammary gland tissues of both WT and Brca1 MT mice at 4-month ( n = 3 mice). h Protein levels of S100a9, TGF-β, and IL-10 in mammary tissues of both WT and Brca1 MT mice at 6-month ( n = 3 mice). The data are expressed as means ± SD ( a ) and P values determined by unpaired two-tailed Student’s t test. The experiments were independently repeated three times with similar results ( a , b ). Source data are provided as a Source data file.

Journal: Nature Communications

Article Title: S100A9-CXCL12 activation in BRCA1-mutant breast cancer promotes an immunosuppressive microenvironment associated with resistance to immunotherapy

doi: 10.1038/s41467-022-29151-5

Figure Lengend Snippet: a S100a9/S100a8 mRNA expression in the subpopulations of luminal and stromal cells of WT 4-month mammary gland (WTV4MG) and MT 4-months-old virgin mammary gland (MTV4MG) ( n = 3 mice). b Protein level of S100a9 in both WT (B477) and MT (G600) mammary epithelial cell lines and tumor tissues by Western blots ( n = 3 individual experiment-up and n = 3 mice-down). c Co-staining of S100a9 (red) and CK18 (green) with antibodies on WTV4MG, MTV4MG, WTV6MG, and MTV6MG tissues ( n = 3 pairs in each group, Scale bar: 20 μM). d The S100a9 and Arg1 positive cell populations by FACS analysis from the blood and mammary tissues of both WT and MT mice at 4-month and 6-month, respectively (FACS gating strategies see in Supplementary Fig. , n = 3 mice/ group). e Co-staining with S100a9 (red) and CD206 (green) antibodies (left panel) and co-staining with S100a9 (red) and CK18 (green) antibodies (right panel) on tumor-adjacent tissues by IF (40X confocal microscope, Scale bar: 20 μM.) ( n = 3 mice and 3 individual experiment). f Secreted S100a9 proteins (left) from both tumor cell and MDSC cells in tumor-adjacent mammary gland ( n = 3 mice) and present in the supernatant of cultured cancer cells (right) ( n = 3 individual experiment, Scale bar: 10 μM). g Protein levels of S100a9, TGF-β, and Il-10 in mammary gland tissues of both WT and Brca1 MT mice at 4-month ( n = 3 mice). h Protein levels of S100a9, TGF-β, and IL-10 in mammary tissues of both WT and Brca1 MT mice at 6-month ( n = 3 mice). The data are expressed as means ± SD ( a ) and P values determined by unpaired two-tailed Student’s t test. The experiments were independently repeated three times with similar results ( a , b ). Source data are provided as a Source data file.

Article Snippet: Mouse Brca1 cDNA (Cat# MG212086) was purchased from Origene.

Techniques: Expressing, Western Blot, Staining, Microscopy, Cell Culture, Two Tailed Test

a The Venn diagram analysis of upregulated genes in G600, Over-Expression- S100a9 in B477 cells (B477-OE-S100a9), and down-regulated genes in G600 cells expressing sg S100A9 (G600-sg S100a9 ) ( n = 3 biological replicates/group). b KEGG Pathway analysis with 453 common ( p value was calculated by hypergeometric test with KOBAS 3.0 website). c Top 20 differentially expressed genes by comparison of the gene expression profiles of four different group cells, including B477-Ctr (B1-3), B477-OE S100a9 (P1-3), G600-Ctr (G1-3), and G600-sg S100a9 (G10-1-3) (the heatmap was drawn by Morpheus website and clustered by One minus Pearson Correlation). d , e Expressions of S100a9 and Cxcl12 at mRNA level by qPCR ( d ) at protein levels by western blotting ( e ) from four group cells in c . f Protein levels of S100a9, Cxcl12 and pStat3 in OE- S100a9 -EMT6 cells, sg S100a9 /OE- S100a9 -EMT6, and sg Cxcl12 /OE- S100a9 -EMT6 cells. g Protein levels of S100a9, Cxcl12 and pStat3 in OE- S100a9 -EMT6 and G600 cells without or with S100A9 inhibitor, Tasquinimod (Tas-50 μM) by western blotting. h Protein levels of S100a9, Cxcl12, and pStat3 in WT (B477) cells with the expression of OE- S100a9 , OE- S100a9 /sg Cxcl12 , or OE- Cxcl12 by western blotting. i , k Protein levels of Cxcl12 in B477 ( i ) cells with OE- S100a9 and in G600 ( k ) cells expressing sg S100a9 at different time courses (0–48 h) and different amounts (0–4 μg) by western blotting. j , l Protein levels of S100a9 in B477 ( j ) cells with OE- Cxcl12 and in G600 ( l ) cells expressing sg Cxcl12 at different time courses (0–48 h) and different amounts (0–4 μg) by western blotting. m Protein levels of S100a9, Cxcl12, and pStat3 in G600 cells after treating with Tas and FPS-ZM1, inhibitor for RAGE receptors on cell membranes by western blotting. n Protein levels of S100a9, Cxcl12, and pStat3 in B477 cells with the expression of sh Brca1 and MT G600 cells with over-expression of Brca1 (OE-Brca1). o A diagram summarizing the relationship of Brca1, S100a9, Cxcl12 and pStat3 in Brca1-MT mammary epithelial cells, and their potential interaction with the surrounding immune microenvironment, which remains elusive. The data are expressed as means ± SD ( d ) and P values determined by one-way ANOVA followed by Tukey’s multiple comparisons. The experiments were independently repeated three times with similar results ( d – n ). Source data are provided as a Source data file.

Journal: Nature Communications

Article Title: S100A9-CXCL12 activation in BRCA1-mutant breast cancer promotes an immunosuppressive microenvironment associated with resistance to immunotherapy

doi: 10.1038/s41467-022-29151-5

Figure Lengend Snippet: a The Venn diagram analysis of upregulated genes in G600, Over-Expression- S100a9 in B477 cells (B477-OE-S100a9), and down-regulated genes in G600 cells expressing sg S100A9 (G600-sg S100a9 ) ( n = 3 biological replicates/group). b KEGG Pathway analysis with 453 common ( p value was calculated by hypergeometric test with KOBAS 3.0 website). c Top 20 differentially expressed genes by comparison of the gene expression profiles of four different group cells, including B477-Ctr (B1-3), B477-OE S100a9 (P1-3), G600-Ctr (G1-3), and G600-sg S100a9 (G10-1-3) (the heatmap was drawn by Morpheus website and clustered by One minus Pearson Correlation). d , e Expressions of S100a9 and Cxcl12 at mRNA level by qPCR ( d ) at protein levels by western blotting ( e ) from four group cells in c . f Protein levels of S100a9, Cxcl12 and pStat3 in OE- S100a9 -EMT6 cells, sg S100a9 /OE- S100a9 -EMT6, and sg Cxcl12 /OE- S100a9 -EMT6 cells. g Protein levels of S100a9, Cxcl12 and pStat3 in OE- S100a9 -EMT6 and G600 cells without or with S100A9 inhibitor, Tasquinimod (Tas-50 μM) by western blotting. h Protein levels of S100a9, Cxcl12, and pStat3 in WT (B477) cells with the expression of OE- S100a9 , OE- S100a9 /sg Cxcl12 , or OE- Cxcl12 by western blotting. i , k Protein levels of Cxcl12 in B477 ( i ) cells with OE- S100a9 and in G600 ( k ) cells expressing sg S100a9 at different time courses (0–48 h) and different amounts (0–4 μg) by western blotting. j , l Protein levels of S100a9 in B477 ( j ) cells with OE- Cxcl12 and in G600 ( l ) cells expressing sg Cxcl12 at different time courses (0–48 h) and different amounts (0–4 μg) by western blotting. m Protein levels of S100a9, Cxcl12, and pStat3 in G600 cells after treating with Tas and FPS-ZM1, inhibitor for RAGE receptors on cell membranes by western blotting. n Protein levels of S100a9, Cxcl12, and pStat3 in B477 cells with the expression of sh Brca1 and MT G600 cells with over-expression of Brca1 (OE-Brca1). o A diagram summarizing the relationship of Brca1, S100a9, Cxcl12 and pStat3 in Brca1-MT mammary epithelial cells, and their potential interaction with the surrounding immune microenvironment, which remains elusive. The data are expressed as means ± SD ( d ) and P values determined by one-way ANOVA followed by Tukey’s multiple comparisons. The experiments were independently repeated three times with similar results ( d – n ). Source data are provided as a Source data file.

Article Snippet: Mouse Brca1 cDNA (Cat# MG212086) was purchased from Origene.

Techniques: Over Expression, Expressing, Western Blot

a – c Migration assay of MDSCs from spleens of WT ( a ) and Brca1-MT ( b ) mice in conditional mediums (CM), including CMs from B477 cells (Ctr-B477), OE- S100a9 in B477 cells (OE-S 100a9 -B477), G600 cells (Ctr-G600), and G600 cells expressing S100a9 (sg- S100a9 -G600). Quantification c in ( a and b , Scale bar: 0.2 mm, n = 16–19 pictures from independently repeated three times, a panel: n = 18 from Ctr-B477, 17 from OE-S100a9-B477, 19 from Ctr-G600 and 17 from sg-S100a9-G600; b panel: n = 16 from Ctr-B477, 16 from OE-S100a9-B477, 17 from Ctr-G600 and 18 from sg-S100a9-G600). d – g Colony formation ( d ) and migrating cells ( f ) of RAW 264.7 cells in different condition mediums (CMs) of Ctr-B477, OE-S 100a9 -B477, Ctr-G600, and sg- S100a9 -G600. Quantifications ( e , n = 52–100 cell colony area from independently repeated three times, n = 87 cells from Ctr-B477, 100 from OE-S100a9-B477, 76 from Ctr-G600 and 52 from sg-S100a9-G600) in d and ( g , n = 7 pictures in each group from independently repeated three times) in f , Scale bar: 0.2 mm. h Protein levels of S100a9, Cxcl12, Cyclin D1, and Arg1 in RAW 264.7 cells with CMs of Ctr-B477, OE-S 100a9 -B477, Ctr-G600, and sg- S100a9 -G600 by western blotting. i , j Protein levels of S100a9, Cxcl12, pStat3, and Arg1 in RAW 264.7 cells treated with CMs from either B477 ( i ) or EMT6 ( j ) cell lines with either S100a9 protein (0.1 mg/ml) or S100a9 protein together with Tas inhibitor by western blotting. k – l The protein levels of S100a9, Cxcl12, pStat3 and Arg1 in RAW264.7 cells treated with CMs from G600 ( k ) and OE-S100a9-EMT6 ( l ) cells without or with Tas, or AMD3465, or Tas and AMD3465 together, respectively, by western blotting. m , n The populations of S100a9 positive ( m ) and MDSC ( n ) cells in both blood and tumors tissues after doxycycline (DOX) induction for 48 h in WT-DOX and MT-DOX mice by FACS analysis with antibodies of S100a9 and CD11b/Gr1( n = 4 mice/group) (FACS gating strategies see in Supplementary Fig. ). o , p MDSC populations from the blood of tumor-bearing mice with implantation of B477 ( o ) or G600 ( p ) cells without or with the expression of sgS100a9 by FACS analysis ( n = 4 mice/group) (FACS gating strategies see in Supplementary Fig. ). q , r MDSC from breast tumor tissues ( q ) and blood samples ( r ) in Balb/c mice with fat pad implantation of Ctr-EMT6 cells, or OE-S100a9-EMT6 cells, or OE-Cxcl12 cells, or OE-S100a9/sgCxcl12 cells by CyTOF analysis ( n = 6–10 mice in each group and randomly mixed them into 3 samples to do CyTOF analysis, q panel: 6 from Ctr, 10 from OE-S100a9, 8 from OE-Cxcl12, 8 from OE-S100a9/sgCxcl12, r panel: 6 from Ctr, 10 from OE-S100a9, 8 from OE-Cxcl12, 8 from OE-S100a9/sgCxcl12, gating strategies see in Supplementary Fig. ). The data are expressed as means ± SD ( c , e , g , m , n , q , r ) and P values determined by one-way ANOVA followed by Tukey’s multiple comparisons. The experiments were independently repeated three times with similar results ( a – l ). Source data are provided as a Source data file.

Journal: Nature Communications

Article Title: S100A9-CXCL12 activation in BRCA1-mutant breast cancer promotes an immunosuppressive microenvironment associated with resistance to immunotherapy

doi: 10.1038/s41467-022-29151-5

Figure Lengend Snippet: a – c Migration assay of MDSCs from spleens of WT ( a ) and Brca1-MT ( b ) mice in conditional mediums (CM), including CMs from B477 cells (Ctr-B477), OE- S100a9 in B477 cells (OE-S 100a9 -B477), G600 cells (Ctr-G600), and G600 cells expressing S100a9 (sg- S100a9 -G600). Quantification c in ( a and b , Scale bar: 0.2 mm, n = 16–19 pictures from independently repeated three times, a panel: n = 18 from Ctr-B477, 17 from OE-S100a9-B477, 19 from Ctr-G600 and 17 from sg-S100a9-G600; b panel: n = 16 from Ctr-B477, 16 from OE-S100a9-B477, 17 from Ctr-G600 and 18 from sg-S100a9-G600). d – g Colony formation ( d ) and migrating cells ( f ) of RAW 264.7 cells in different condition mediums (CMs) of Ctr-B477, OE-S 100a9 -B477, Ctr-G600, and sg- S100a9 -G600. Quantifications ( e , n = 52–100 cell colony area from independently repeated three times, n = 87 cells from Ctr-B477, 100 from OE-S100a9-B477, 76 from Ctr-G600 and 52 from sg-S100a9-G600) in d and ( g , n = 7 pictures in each group from independently repeated three times) in f , Scale bar: 0.2 mm. h Protein levels of S100a9, Cxcl12, Cyclin D1, and Arg1 in RAW 264.7 cells with CMs of Ctr-B477, OE-S 100a9 -B477, Ctr-G600, and sg- S100a9 -G600 by western blotting. i , j Protein levels of S100a9, Cxcl12, pStat3, and Arg1 in RAW 264.7 cells treated with CMs from either B477 ( i ) or EMT6 ( j ) cell lines with either S100a9 protein (0.1 mg/ml) or S100a9 protein together with Tas inhibitor by western blotting. k – l The protein levels of S100a9, Cxcl12, pStat3 and Arg1 in RAW264.7 cells treated with CMs from G600 ( k ) and OE-S100a9-EMT6 ( l ) cells without or with Tas, or AMD3465, or Tas and AMD3465 together, respectively, by western blotting. m , n The populations of S100a9 positive ( m ) and MDSC ( n ) cells in both blood and tumors tissues after doxycycline (DOX) induction for 48 h in WT-DOX and MT-DOX mice by FACS analysis with antibodies of S100a9 and CD11b/Gr1( n = 4 mice/group) (FACS gating strategies see in Supplementary Fig. ). o , p MDSC populations from the blood of tumor-bearing mice with implantation of B477 ( o ) or G600 ( p ) cells without or with the expression of sgS100a9 by FACS analysis ( n = 4 mice/group) (FACS gating strategies see in Supplementary Fig. ). q , r MDSC from breast tumor tissues ( q ) and blood samples ( r ) in Balb/c mice with fat pad implantation of Ctr-EMT6 cells, or OE-S100a9-EMT6 cells, or OE-Cxcl12 cells, or OE-S100a9/sgCxcl12 cells by CyTOF analysis ( n = 6–10 mice in each group and randomly mixed them into 3 samples to do CyTOF analysis, q panel: 6 from Ctr, 10 from OE-S100a9, 8 from OE-Cxcl12, 8 from OE-S100a9/sgCxcl12, r panel: 6 from Ctr, 10 from OE-S100a9, 8 from OE-Cxcl12, 8 from OE-S100a9/sgCxcl12, gating strategies see in Supplementary Fig. ). The data are expressed as means ± SD ( c , e , g , m , n , q , r ) and P values determined by one-way ANOVA followed by Tukey’s multiple comparisons. The experiments were independently repeated three times with similar results ( a – l ). Source data are provided as a Source data file.

Article Snippet: Mouse Brca1 cDNA (Cat# MG212086) was purchased from Origene.

Techniques: Migration, Expressing, Western Blot

a , b Representative tumor images ( a ) and volume ( b ) from Balb/C mice after 35 days pad implantation with EMT6-Ctr cells, sg S100A9 -EMT6, and sg Cxcl12 -EMT6 cells at 1 × 10 6 cells per fat pad ( n = 15 mice). c Proliferation of EMT6 cells and EMT6 cells expressing either sg S100a9 or sg Cxcl12 in vitro. d The percent of different immune cells in tumor tissues without or with expression of sg S100a9 and sg Cxcl12 in Balb/C mice by CyTOF analysis with antibodies to CD3/CD4, CD3/CD8, CD11b/Ly6G, CD11b/Ly6C, and CD3/CD28 ( n = 3 mice/group). e CXCL12 expression in either BRCA1 -high and S100A9 -low ( n = 498) or BRCA1 -low and S100A9 -high ( n = 160) breast cancer patients from the TCGA breast database. f Overall survival of breast cancer patients with low expression of BRCA1 and high expression of S100A9 from the GSE19783-GPL6480 database ( n = 216). g , h Tumor volumes and representative images of tumors formed from 231 cells without or with expression of sg S100A9 in nude mice ( n = 9 mice/group). i – l Outline of treatment strategy with PBS ( n = 10 mice), PD1 antibody ( n = 6 mice), Tas ( n = 3 mice), or PD1 antibody together with Tas ( n = 5 mice) for Brca1 -MT mice ( i ). Volumes and numbers of tumors ( j ), representative images of lungs and livers ( k ), and sections of the primary tumor ( l ) before treatment (left) and the residual mammary tissue of the same mouse after treatment (right). PD1 antibody was administered at day one (D1) and D21, respectively, after removing the primary tumor when the size of tumors reached 1 cm in size. Other drugs were used every day starting from D2. m , n Tumor images ( m ) and volume ( n ) at D29 from FVB mice with fat pad implantation of 545 cells and treatment with PBS and αPD1 ( n = 7 mice/group). o , p Tumor volumes and representative images at the D29 from FVB mice with implantation of 545 cells (4 × 10 6 cells/fat pad) and treatment with PBS ( n = 6 mice), AMD3465 (AMD) + αPD1 ( n = 7 mice), and Tas + αPD1 ( n = 7 mice). q , r Immune cell populations in CD45 + cells from the same cohorts of mice in (M-P) by CyTOF analysis at D13 and D29 ( n = 3 mice/group, CyTOF gating strategies see in Supplementary Fig. ). The data are expressed as means ± SD ( b , d , g , j , n , p ) and P values determined by unpaired two-tailed Student’s t test ( g , n ) and by one-way ANOVA followed by Tukey’s multiple comparisons ( b , d , j , p , q , r ). The experiments were independently repeated three times with similar results ( c ). Scale bar: black color, 100 μM. Source data are provided as a Source data file.

Journal: Nature Communications

Article Title: S100A9-CXCL12 activation in BRCA1-mutant breast cancer promotes an immunosuppressive microenvironment associated with resistance to immunotherapy

doi: 10.1038/s41467-022-29151-5

Figure Lengend Snippet: a , b Representative tumor images ( a ) and volume ( b ) from Balb/C mice after 35 days pad implantation with EMT6-Ctr cells, sg S100A9 -EMT6, and sg Cxcl12 -EMT6 cells at 1 × 10 6 cells per fat pad ( n = 15 mice). c Proliferation of EMT6 cells and EMT6 cells expressing either sg S100a9 or sg Cxcl12 in vitro. d The percent of different immune cells in tumor tissues without or with expression of sg S100a9 and sg Cxcl12 in Balb/C mice by CyTOF analysis with antibodies to CD3/CD4, CD3/CD8, CD11b/Ly6G, CD11b/Ly6C, and CD3/CD28 ( n = 3 mice/group). e CXCL12 expression in either BRCA1 -high and S100A9 -low ( n = 498) or BRCA1 -low and S100A9 -high ( n = 160) breast cancer patients from the TCGA breast database. f Overall survival of breast cancer patients with low expression of BRCA1 and high expression of S100A9 from the GSE19783-GPL6480 database ( n = 216). g , h Tumor volumes and representative images of tumors formed from 231 cells without or with expression of sg S100A9 in nude mice ( n = 9 mice/group). i – l Outline of treatment strategy with PBS ( n = 10 mice), PD1 antibody ( n = 6 mice), Tas ( n = 3 mice), or PD1 antibody together with Tas ( n = 5 mice) for Brca1 -MT mice ( i ). Volumes and numbers of tumors ( j ), representative images of lungs and livers ( k ), and sections of the primary tumor ( l ) before treatment (left) and the residual mammary tissue of the same mouse after treatment (right). PD1 antibody was administered at day one (D1) and D21, respectively, after removing the primary tumor when the size of tumors reached 1 cm in size. Other drugs were used every day starting from D2. m , n Tumor images ( m ) and volume ( n ) at D29 from FVB mice with fat pad implantation of 545 cells and treatment with PBS and αPD1 ( n = 7 mice/group). o , p Tumor volumes and representative images at the D29 from FVB mice with implantation of 545 cells (4 × 10 6 cells/fat pad) and treatment with PBS ( n = 6 mice), AMD3465 (AMD) + αPD1 ( n = 7 mice), and Tas + αPD1 ( n = 7 mice). q , r Immune cell populations in CD45 + cells from the same cohorts of mice in (M-P) by CyTOF analysis at D13 and D29 ( n = 3 mice/group, CyTOF gating strategies see in Supplementary Fig. ). The data are expressed as means ± SD ( b , d , g , j , n , p ) and P values determined by unpaired two-tailed Student’s t test ( g , n ) and by one-way ANOVA followed by Tukey’s multiple comparisons ( b , d , j , p , q , r ). The experiments were independently repeated three times with similar results ( c ). Scale bar: black color, 100 μM. Source data are provided as a Source data file.

Article Snippet: Mouse Brca1 cDNA (Cat# MG212086) was purchased from Origene.

Techniques: Expressing, In Vitro, Two Tailed Test

In BRCA1 deficiency epithelial cells, S100A9 expression level constantly increases in early stages and secrets out to recruit and activate MDSCs, which creates an immunosuppression microenvironment by inhibit expansion and activation of T cells. This process can be further enhanced by CXCL12 that positively regulated by S100A9 and form a positive feedback loop. And this immunosuppression microenvironment is beneficial for tumor growth. The inhibitors of S100A9 and CXCL12, Tasquinimod and AMD3465, combine with anti-PD1 antibody can rescue the immunosuppression microenvironment and repress tumor growth. Green arrows indicate a decrease; red arrows indicate an increase.

Journal: Nature Communications

Article Title: S100A9-CXCL12 activation in BRCA1-mutant breast cancer promotes an immunosuppressive microenvironment associated with resistance to immunotherapy

doi: 10.1038/s41467-022-29151-5

Figure Lengend Snippet: In BRCA1 deficiency epithelial cells, S100A9 expression level constantly increases in early stages and secrets out to recruit and activate MDSCs, which creates an immunosuppression microenvironment by inhibit expansion and activation of T cells. This process can be further enhanced by CXCL12 that positively regulated by S100A9 and form a positive feedback loop. And this immunosuppression microenvironment is beneficial for tumor growth. The inhibitors of S100A9 and CXCL12, Tasquinimod and AMD3465, combine with anti-PD1 antibody can rescue the immunosuppression microenvironment and repress tumor growth. Green arrows indicate a decrease; red arrows indicate an increase.

Article Snippet: Mouse Brca1 cDNA (Cat# MG212086) was purchased from Origene.

Techniques: Expressing, Activation Assay

FIG. 1. Purification and functional char- acterization of dimeric TRF. A) Chromato- graphic profile of highly purified human TRF. The TRF solution was loaded onto an ultragel Aca44 column as described in Materials and Methods. OD, optical density. B) Each fraction was analyzed using native gel electrophoresis and immunoblotting. VLMB, very low-mobility band; LMB, low- mobility band; HMB, high-mobility band. C) Sensorgrams of interaction between high- and low-mobility purified fractions of hTRF and the monoclonal anti-hTRF anti- body. The interaction between both forms of hTRF and the monoclonal antibody is indicated by a dashed line. After reinjection of the monoclonal antibody, only the accessible epitope on the dimeric form generated a secondary signal (dark line), in contrast to the monomeric form (light line). The arrows directed to the top indicate the beginning of injection of the anti-hTRF antibody, and those directed toward the bottom indicate the end of the injections. The principle of discrimination between monomeric versus dimeric TRF by SPR is schematized on the right. RU, resonance units.

Journal: Biology of reproduction

Article Title: Dimeric transferrin inhibits phagocytosis of residual bodies by testicular rat Sertoli cells.

doi: 10.1095/biolreprod.107.063107

Figure Lengend Snippet: FIG. 1. Purification and functional char- acterization of dimeric TRF. A) Chromato- graphic profile of highly purified human TRF. The TRF solution was loaded onto an ultragel Aca44 column as described in Materials and Methods. OD, optical density. B) Each fraction was analyzed using native gel electrophoresis and immunoblotting. VLMB, very low-mobility band; LMB, low- mobility band; HMB, high-mobility band. C) Sensorgrams of interaction between high- and low-mobility purified fractions of hTRF and the monoclonal anti-hTRF anti- body. The interaction between both forms of hTRF and the monoclonal antibody is indicated by a dashed line. After reinjection of the monoclonal antibody, only the accessible epitope on the dimeric form generated a secondary signal (dark line), in contrast to the monomeric form (light line). The arrows directed to the top indicate the beginning of injection of the anti-hTRF antibody, and those directed toward the bottom indicate the end of the injections. The principle of discrimination between monomeric versus dimeric TRF by SPR is schematized on the right. RU, resonance units.

Article Snippet: Monoclonal mouse antibodies raised against the N-terminal domain of human TRF were from AbD Serotec (Cergy Saint-Christophe, France).

Techniques: Purification, Functional Assay, Nucleic Acid Electrophoresis, Western Blot, Generated, Injection

(A) Selected results of a gene essentiality screen in BRCA1-proficient and -deficient RPE1 cells ( Adam et al. , 2021 ). Plotted is the CCA score: a higher score indicates a unique essentiality in BRCA1-deficient cells compared to -proficient cells. Dashed line indicates the cut-off for a significant CCA score (based on Adam et al. , 2021 ). (B) RPE1 hTERT cells expressing Cas9, either TP53 -/- (black lines) or TP53 -/- BRCA1 -/- (blue lines), were infected with indicated sgRNA together with GFP, or with an empty vector together with mCherry. GFP- and mCherry-positive cells were mixed 1:1, and the frequency of GFP-positive cells in the population was determined at multiple time points (n=4, mean±SEM). Western blot of lysates shown in supplemental figure 1A. (C) RPE1 hTERT PAC -/- TP53 -/- cells were genetically modified to generate a BRCA1-mAID-GFP fusion gene at the endogenous BRCA1 -locus. In this genetic background, two clonal EXO1 -/- cell lines were generated using gene editing techniques. Cells were treated with auxin (500 μM) for 48 hours or left untreated, and lysates were analysed by western blotting. (D) The cell lines described in were treated with 500 μM auxin, or left untreated, and clonogenic survival was determined. Lower panel shows a representative experiment, top panel shows the quantification (n=4, mean+SEM, *p<0.05, **p<0.01, paired t-test). (E) BRCA1 -mutated MDA-MB-436 cells, either WT or reconstituted with BRCA1, were infected with empty vector (CTRL) or EXO1 -targeting sgRNA and viability was measured using CellTiter-Glo (n=3, mean+SD, **p<0.01, paired t-test). (F) Lysates of the MDA-MB-436 cell lines described in were analysed by western blotting. (G) RPE1 hTERT TP53 -/- BRCA1-mAID-GFP cell lines were virally transduced to express Cas9 cDNA and the indicated gRNAs, followed by a clonogenic survival assay in presence or absence of 500 μM Auxin (n=3, mean+SD, **p<0.01, paired t-test). Western blot of lysates shown in supplemental figure 1L.

Journal: bioRxiv

Article Title: EXO1-mediated DNA repair by single-strand annealing is essential for BRCA1-deficient cells

doi: 10.1101/2023.02.24.529205

Figure Lengend Snippet: (A) Selected results of a gene essentiality screen in BRCA1-proficient and -deficient RPE1 cells ( Adam et al. , 2021 ). Plotted is the CCA score: a higher score indicates a unique essentiality in BRCA1-deficient cells compared to -proficient cells. Dashed line indicates the cut-off for a significant CCA score (based on Adam et al. , 2021 ). (B) RPE1 hTERT cells expressing Cas9, either TP53 -/- (black lines) or TP53 -/- BRCA1 -/- (blue lines), were infected with indicated sgRNA together with GFP, or with an empty vector together with mCherry. GFP- and mCherry-positive cells were mixed 1:1, and the frequency of GFP-positive cells in the population was determined at multiple time points (n=4, mean±SEM). Western blot of lysates shown in supplemental figure 1A. (C) RPE1 hTERT PAC -/- TP53 -/- cells were genetically modified to generate a BRCA1-mAID-GFP fusion gene at the endogenous BRCA1 -locus. In this genetic background, two clonal EXO1 -/- cell lines were generated using gene editing techniques. Cells were treated with auxin (500 μM) for 48 hours or left untreated, and lysates were analysed by western blotting. (D) The cell lines described in were treated with 500 μM auxin, or left untreated, and clonogenic survival was determined. Lower panel shows a representative experiment, top panel shows the quantification (n=4, mean+SEM, *p<0.05, **p<0.01, paired t-test). (E) BRCA1 -mutated MDA-MB-436 cells, either WT or reconstituted with BRCA1, were infected with empty vector (CTRL) or EXO1 -targeting sgRNA and viability was measured using CellTiter-Glo (n=3, mean+SD, **p<0.01, paired t-test). (F) Lysates of the MDA-MB-436 cell lines described in were analysed by western blotting. (G) RPE1 hTERT TP53 -/- BRCA1-mAID-GFP cell lines were virally transduced to express Cas9 cDNA and the indicated gRNAs, followed by a clonogenic survival assay in presence or absence of 500 μM Auxin (n=3, mean+SD, **p<0.01, paired t-test). Western blot of lysates shown in supplemental figure 1L.

Article Snippet: The following primary antibodies were used for western blotting: Mouse α 53BP1 (BD 612522; 1:1,500), Rabbit α BLM (Abcam ab2179; 1:2,000), Mouse α BRCA1 (Merck OP92; 1:1,000), Rabbit α BRCA1 (Millipore 07-434; 1:2,000), Mouse α BRCA2 (Merck OP95; 1:1,000), Mouse α CTIP (Millipore MABE1060; 1:1,000), Rabbit α EXO1 (Abcam ab95068; 1:1,000), Rabbit α EXO1 (Millipore ABE1354; 1:1,000), Mouse α GFP (Sigma #11814460001; 1:1000), Rabbit α MRE11 (1:3,000; de Jager et al., 2001), Mouse α TUBULIN (Sigma T6199; 1:5,000), and Mouse α RAD52 (Santa-Cruz sc-365341; 1:100).

Techniques: Expressing, Infection, Plasmid Preparation, Western Blot, Genetically Modified, Generated, Clonogenic Cell Survival Assay

(A) Primary breast tumour samples (Staaf et al. 2019, n=247) were divided in groups based on the presence of biallelic BRCA1 mutations ( BRCA1 mut) or BRCA1 promotor hypermethylation ( BRCA1 prom. MET), and gene expression of indicated genes were plotted. (B) As in , but for another cohort of breast cancer patients in which groups were divided on the presence of deleterious BRCA1 mutations ( Nik-Zainal et al. , 2016 , n=342). (C) For tumour samples of the TCGA breast cancer dataset (n=1,048), the correlation between the HRD score and expression level of an individual gene was determined. Plotted are the Pearson correlation coefficient for each of 60,000 measured transcripts. (D) HRD score and expression of the indicated genes were plotted for each tumour sample in the TCGA breast cancer dataset (n=1,048). Red line is the linear regression curve, PC=Pearson correlation coefficient.

Journal: bioRxiv

Article Title: EXO1-mediated DNA repair by single-strand annealing is essential for BRCA1-deficient cells

doi: 10.1101/2023.02.24.529205

Figure Lengend Snippet: (A) Primary breast tumour samples (Staaf et al. 2019, n=247) were divided in groups based on the presence of biallelic BRCA1 mutations ( BRCA1 mut) or BRCA1 promotor hypermethylation ( BRCA1 prom. MET), and gene expression of indicated genes were plotted. (B) As in , but for another cohort of breast cancer patients in which groups were divided on the presence of deleterious BRCA1 mutations ( Nik-Zainal et al. , 2016 , n=342). (C) For tumour samples of the TCGA breast cancer dataset (n=1,048), the correlation between the HRD score and expression level of an individual gene was determined. Plotted are the Pearson correlation coefficient for each of 60,000 measured transcripts. (D) HRD score and expression of the indicated genes were plotted for each tumour sample in the TCGA breast cancer dataset (n=1,048). Red line is the linear regression curve, PC=Pearson correlation coefficient.

Article Snippet: The following primary antibodies were used for western blotting: Mouse α 53BP1 (BD 612522; 1:1,500), Rabbit α BLM (Abcam ab2179; 1:2,000), Mouse α BRCA1 (Merck OP92; 1:1,000), Rabbit α BRCA1 (Millipore 07-434; 1:2,000), Mouse α BRCA2 (Merck OP95; 1:1,000), Mouse α CTIP (Millipore MABE1060; 1:1,000), Rabbit α EXO1 (Abcam ab95068; 1:1,000), Rabbit α EXO1 (Millipore ABE1354; 1:1,000), Mouse α GFP (Sigma #11814460001; 1:1000), Rabbit α MRE11 (1:3,000; de Jager et al., 2001), Mouse α TUBULIN (Sigma T6199; 1:5,000), and Mouse α RAD52 (Santa-Cruz sc-365341; 1:100).

Techniques: Expressing

(A) RPE1 hTERT TP53 -/- BRCA1-mAID-GFP cells, either EXO1 +/+ or EXO1 -/- , were treated with 500 μM auxin for 48 hours to deplete BRCA1 or left untreated. This was followed by Hoechst staining and microscopic quantification of the number of micronuclei (n=5, mean+SD, *p<0.05, ratio paired t-test). (B) RPE1 hTERT TP53 -/- BRCA1 -/- cells expressing Cas9 were infected with sgEXO1 . Next, DAPI-stained nuclei were analysed by microscopy to quantify the number of micronuclei (n=3, mean+SD, ratio paired t-test). (C) RPE1 hTERT TP53 -/- BRCA1-mAID-GFP , either EXO1 +/+ or EXO1 -/- , were treated with 500 μM auxin for 48 hours to deplete BRCA1 or left untreated. Next, metaphase spreads were analysed for chromosomal aberrations. Right panel shows a representative experiment with blue arrows indicating aberrations, left panel shows the quantification (n=3, >40 metaphases per replicate, mean). (D) Data depicted in panel C was re-plotted to show the absolute number of chromosomal aberrations, either chromatid type or chromosome type. (E) RPE1 hTERT TP53 -/- BRCA1-mAID-GFP cells, either EXO1 +/+ or EXO1 -/- , were treated with 500 μM auxin for 48 hours to deplete BRCA1 or left untreated. Nuclear γH2AX intensity in S-phase (EdU + ) cells was analysed by IF microscopy. A representative of two independent experiments is shown, black line indicates median (****p<0.0001, Mann-Whitney). (F) Nuclear γH2AX intensity in S-phase (EdU + ) cells analysed by IF microscopy in BRCA1 -mutated MDA-MB-436 cells, either WT or reconstituted with BRCA1 cDNA, infected with empty vector (CTRL) or EXO1-targeting shRNA. A representative of two independent experiments is shown, black line indicates median (****p<0.0001, Mann-Whitney).

Journal: bioRxiv

Article Title: EXO1-mediated DNA repair by single-strand annealing is essential for BRCA1-deficient cells

doi: 10.1101/2023.02.24.529205

Figure Lengend Snippet: (A) RPE1 hTERT TP53 -/- BRCA1-mAID-GFP cells, either EXO1 +/+ or EXO1 -/- , were treated with 500 μM auxin for 48 hours to deplete BRCA1 or left untreated. This was followed by Hoechst staining and microscopic quantification of the number of micronuclei (n=5, mean+SD, *p<0.05, ratio paired t-test). (B) RPE1 hTERT TP53 -/- BRCA1 -/- cells expressing Cas9 were infected with sgEXO1 . Next, DAPI-stained nuclei were analysed by microscopy to quantify the number of micronuclei (n=3, mean+SD, ratio paired t-test). (C) RPE1 hTERT TP53 -/- BRCA1-mAID-GFP , either EXO1 +/+ or EXO1 -/- , were treated with 500 μM auxin for 48 hours to deplete BRCA1 or left untreated. Next, metaphase spreads were analysed for chromosomal aberrations. Right panel shows a representative experiment with blue arrows indicating aberrations, left panel shows the quantification (n=3, >40 metaphases per replicate, mean). (D) Data depicted in panel C was re-plotted to show the absolute number of chromosomal aberrations, either chromatid type or chromosome type. (E) RPE1 hTERT TP53 -/- BRCA1-mAID-GFP cells, either EXO1 +/+ or EXO1 -/- , were treated with 500 μM auxin for 48 hours to deplete BRCA1 or left untreated. Nuclear γH2AX intensity in S-phase (EdU + ) cells was analysed by IF microscopy. A representative of two independent experiments is shown, black line indicates median (****p<0.0001, Mann-Whitney). (F) Nuclear γH2AX intensity in S-phase (EdU + ) cells analysed by IF microscopy in BRCA1 -mutated MDA-MB-436 cells, either WT or reconstituted with BRCA1 cDNA, infected with empty vector (CTRL) or EXO1-targeting shRNA. A representative of two independent experiments is shown, black line indicates median (****p<0.0001, Mann-Whitney).

Article Snippet: The following primary antibodies were used for western blotting: Mouse α 53BP1 (BD 612522; 1:1,500), Rabbit α BLM (Abcam ab2179; 1:2,000), Mouse α BRCA1 (Merck OP92; 1:1,000), Rabbit α BRCA1 (Millipore 07-434; 1:2,000), Mouse α BRCA2 (Merck OP95; 1:1,000), Mouse α CTIP (Millipore MABE1060; 1:1,000), Rabbit α EXO1 (Abcam ab95068; 1:1,000), Rabbit α EXO1 (Millipore ABE1354; 1:1,000), Mouse α GFP (Sigma #11814460001; 1:1000), Rabbit α MRE11 (1:3,000; de Jager et al., 2001), Mouse α TUBULIN (Sigma T6199; 1:5,000), and Mouse α RAD52 (Santa-Cruz sc-365341; 1:100).

Techniques: Staining, Expressing, Infection, Microscopy, MANN-WHITNEY, Plasmid Preparation, shRNA

(A) RPE1 hTERT TP53 -/- BRCA1 -/- cells expressing Cas9, either TP53BP1 +/+ or TP53BP1 -/- , were transduced with an AAVS1-targeting (CTRL) or EXO1 -targeting sgRNA, followed by a clonogenic survival assay (n=3, mean+SD, **p<0.01, paired t-test). Western blot of lysates shown in supplemental figure 2A. (B) Indicated RPE1 cell lines were incubated with EdU and PARGi for 30 minutes, followed by IF microscopy to analyse PAR formation in EdU-positive cells. A representative of two independent experiments is shown, black line indicates median (****p<0.0001, Mann-Whitney). (C) As in , but for BRCA1 -mutated MDA-MB-436 cells, either WT or reconstituted with BRCA1 cDNA, infected with empty vector (CTRL) or EXO1 -targeting sgRNA. A representative of three independent experiments is shown, black line indicates median (****p<0.0001, Mann-Whitney). (D) As in , but for DLD1 cells, either WT or BRCA2 -/- . A representative of three independent experiments is shown, black line indicates median (****p<0.0001, Mann-Whitney).

Journal: bioRxiv

Article Title: EXO1-mediated DNA repair by single-strand annealing is essential for BRCA1-deficient cells

doi: 10.1101/2023.02.24.529205

Figure Lengend Snippet: (A) RPE1 hTERT TP53 -/- BRCA1 -/- cells expressing Cas9, either TP53BP1 +/+ or TP53BP1 -/- , were transduced with an AAVS1-targeting (CTRL) or EXO1 -targeting sgRNA, followed by a clonogenic survival assay (n=3, mean+SD, **p<0.01, paired t-test). Western blot of lysates shown in supplemental figure 2A. (B) Indicated RPE1 cell lines were incubated with EdU and PARGi for 30 minutes, followed by IF microscopy to analyse PAR formation in EdU-positive cells. A representative of two independent experiments is shown, black line indicates median (****p<0.0001, Mann-Whitney). (C) As in , but for BRCA1 -mutated MDA-MB-436 cells, either WT or reconstituted with BRCA1 cDNA, infected with empty vector (CTRL) or EXO1 -targeting sgRNA. A representative of three independent experiments is shown, black line indicates median (****p<0.0001, Mann-Whitney). (D) As in , but for DLD1 cells, either WT or BRCA2 -/- . A representative of three independent experiments is shown, black line indicates median (****p<0.0001, Mann-Whitney).

Article Snippet: The following primary antibodies were used for western blotting: Mouse α 53BP1 (BD 612522; 1:1,500), Rabbit α BLM (Abcam ab2179; 1:2,000), Mouse α BRCA1 (Merck OP92; 1:1,000), Rabbit α BRCA1 (Millipore 07-434; 1:2,000), Mouse α BRCA2 (Merck OP95; 1:1,000), Mouse α CTIP (Millipore MABE1060; 1:1,000), Rabbit α EXO1 (Abcam ab95068; 1:1,000), Rabbit α EXO1 (Millipore ABE1354; 1:1,000), Mouse α GFP (Sigma #11814460001; 1:1000), Rabbit α MRE11 (1:3,000; de Jager et al., 2001), Mouse α TUBULIN (Sigma T6199; 1:5,000), and Mouse α RAD52 (Santa-Cruz sc-365341; 1:100).

Techniques: Expressing, Transduction, Clonogenic Cell Survival Assay, Western Blot, Incubation, Microscopy, MANN-WHITNEY, Infection, Plasmid Preparation

(A) Results of a gene essentiality screen in BRCA1-proficient and -deficient cells ( Adam et al. , 2021 ) were mined to extract the CCA scores for the indicated genes. A higher CCA score indicates a unique essentiality in BRCA1-deficient cells compared to proficient cells. Dashed line indicates the cut-off for a significant CCA score (based on Adam et al. , 2021 ). (B) Indicated RPE1 cells were transfected with a control (siCTRL) or EXO1 -targeting siRNA, followed by treatment with IR and subsequent IF microscopy to analyse either RAD51 or RAD52 foci formation. Left panel shows quantification (n=3, mean+SD, *p<0.05, paired t-test) and right panel shows representative microscopy images of eGFP-RAD52 foci. Western blot of lysates shown in supplemental figure 3A. (C) Clonogenic survival assay of Cas9-expressing RPE1 hTERT TP53 -/- BRCA1 -/- cells that were transduced to express the indicated sgRNAs (n=3, mean+SD, *p<0.05, **p<0.01, one-way ANOVA, post-hoc Dunnett’s, compared to CTRL). Western blot of lysates shown in supplemental figure 3D. (D) HEK 293T cells carrying the DSB-Spectrum_V3 reporter, either WT or EXO1 -/- , were transfected with indicated siRNAs, followed by a second round of transfection with a Cas9 cDNA and BFP sgRNA targeting the reporter locus. Next, cells were analysed by flow cytometry to quantify repair by the indicated pathways (n=4, mean±SEM, *p<0.05, ratio paired t-test). Western blot of lysates shown in supplemental figure 3E. (E) Nuclear γH2AX intensity in S-phase (EdU + ) cells analysed by IF microscopy in BRCA2 -/- cells infected with empty vector or sgEXO1 . A representative of two independent experiments is shown, black line indicates median.

Journal: bioRxiv

Article Title: EXO1-mediated DNA repair by single-strand annealing is essential for BRCA1-deficient cells

doi: 10.1101/2023.02.24.529205

Figure Lengend Snippet: (A) Results of a gene essentiality screen in BRCA1-proficient and -deficient cells ( Adam et al. , 2021 ) were mined to extract the CCA scores for the indicated genes. A higher CCA score indicates a unique essentiality in BRCA1-deficient cells compared to proficient cells. Dashed line indicates the cut-off for a significant CCA score (based on Adam et al. , 2021 ). (B) Indicated RPE1 cells were transfected with a control (siCTRL) or EXO1 -targeting siRNA, followed by treatment with IR and subsequent IF microscopy to analyse either RAD51 or RAD52 foci formation. Left panel shows quantification (n=3, mean+SD, *p<0.05, paired t-test) and right panel shows representative microscopy images of eGFP-RAD52 foci. Western blot of lysates shown in supplemental figure 3A. (C) Clonogenic survival assay of Cas9-expressing RPE1 hTERT TP53 -/- BRCA1 -/- cells that were transduced to express the indicated sgRNAs (n=3, mean+SD, *p<0.05, **p<0.01, one-way ANOVA, post-hoc Dunnett’s, compared to CTRL). Western blot of lysates shown in supplemental figure 3D. (D) HEK 293T cells carrying the DSB-Spectrum_V3 reporter, either WT or EXO1 -/- , were transfected with indicated siRNAs, followed by a second round of transfection with a Cas9 cDNA and BFP sgRNA targeting the reporter locus. Next, cells were analysed by flow cytometry to quantify repair by the indicated pathways (n=4, mean±SEM, *p<0.05, ratio paired t-test). Western blot of lysates shown in supplemental figure 3E. (E) Nuclear γH2AX intensity in S-phase (EdU + ) cells analysed by IF microscopy in BRCA2 -/- cells infected with empty vector or sgEXO1 . A representative of two independent experiments is shown, black line indicates median.

Article Snippet: The following primary antibodies were used for western blotting: Mouse α 53BP1 (BD 612522; 1:1,500), Rabbit α BLM (Abcam ab2179; 1:2,000), Mouse α BRCA1 (Merck OP92; 1:1,000), Rabbit α BRCA1 (Millipore 07-434; 1:2,000), Mouse α BRCA2 (Merck OP95; 1:1,000), Mouse α CTIP (Millipore MABE1060; 1:1,000), Rabbit α EXO1 (Abcam ab95068; 1:1,000), Rabbit α EXO1 (Millipore ABE1354; 1:1,000), Mouse α GFP (Sigma #11814460001; 1:1000), Rabbit α MRE11 (1:3,000; de Jager et al., 2001), Mouse α TUBULIN (Sigma T6199; 1:5,000), and Mouse α RAD52 (Santa-Cruz sc-365341; 1:100).

Techniques: Transfection, Microscopy, Western Blot, Clonogenic Cell Survival Assay, Expressing, Flow Cytometry, Infection, Plasmid Preparation

(A) Model of the mechanism causing synthetic lethality between BRCA1-deficiency and EXO1 loss. (B) Whole genome sequencing data of pan cancer tumour samples ( Martínez-Jiménez et al. , 2022 ) was analysed to quantify the number of genetic scars indicative of DSB-repair by SSA, here defined as deletions flanked by homologous sequences of >10bp. CHORD analysis was used to classify samples as HR-proficient or HR-deficient, either BRCA1-type or BRCA2-type ( Nguyen et al. , 2020 ) (****p<0.0001, kolmogornov-smirnov). (C) Tumour samples from a pan-cancer cohort were binned based on SSA scar count, and the EXO1 expression was plotted for each tumour sample. (D) EXO1 expression levels in BRCA1 WT or BRCA1 mutant pan-cancer tumour samples.

Journal: bioRxiv

Article Title: EXO1-mediated DNA repair by single-strand annealing is essential for BRCA1-deficient cells

doi: 10.1101/2023.02.24.529205

Figure Lengend Snippet: (A) Model of the mechanism causing synthetic lethality between BRCA1-deficiency and EXO1 loss. (B) Whole genome sequencing data of pan cancer tumour samples ( Martínez-Jiménez et al. , 2022 ) was analysed to quantify the number of genetic scars indicative of DSB-repair by SSA, here defined as deletions flanked by homologous sequences of >10bp. CHORD analysis was used to classify samples as HR-proficient or HR-deficient, either BRCA1-type or BRCA2-type ( Nguyen et al. , 2020 ) (****p<0.0001, kolmogornov-smirnov). (C) Tumour samples from a pan-cancer cohort were binned based on SSA scar count, and the EXO1 expression was plotted for each tumour sample. (D) EXO1 expression levels in BRCA1 WT or BRCA1 mutant pan-cancer tumour samples.

Article Snippet: The following primary antibodies were used for western blotting: Mouse α 53BP1 (BD 612522; 1:1,500), Rabbit α BLM (Abcam ab2179; 1:2,000), Mouse α BRCA1 (Merck OP92; 1:1,000), Rabbit α BRCA1 (Millipore 07-434; 1:2,000), Mouse α BRCA2 (Merck OP95; 1:1,000), Mouse α CTIP (Millipore MABE1060; 1:1,000), Rabbit α EXO1 (Abcam ab95068; 1:1,000), Rabbit α EXO1 (Millipore ABE1354; 1:1,000), Mouse α GFP (Sigma #11814460001; 1:1000), Rabbit α MRE11 (1:3,000; de Jager et al., 2001), Mouse α TUBULIN (Sigma T6199; 1:5,000), and Mouse α RAD52 (Santa-Cruz sc-365341; 1:100).

Techniques: Sequencing, Expressing, Mutagenesis